
Introduction To Heart Rate Variability
Heart Rate Variability (HRV) measures the variation in time between successive heartbeats. HRV is measured in milliseconds and indicates the health and balance of the autonomic nervous system (ANS). HRV is the most efficient, non-invasive, and affordable method to assess the function of the autonomic nervous system. The ANS works to maintain balance, also known as homeostasis, as the body constantly adjusts to handle stressors. This system regulates heart rate, blood pressure, hormone levels, glucose, and more to ensure optimal functioning, prevent chronic conditions, and improve performance.
HRV values that remain stable or trend upward over time indicate good overall health and a healthy ANS. In contrast, a downward-trending HRV indicates an autonomic imbalance associated with an increased risk of cardiovascular disease, chronic stress, and other health issues.
HRV is important because it provides valuable measures that can monitor the effectiveness of athletic training. It can also help to identify potential health problems early and allow for prompt treatment. Additionally, research has shown that HRV can predict the risk of future cardiovascular events, such as heart attacks, and monitor the effectiveness of treatments for cardiovascular disease and other health conditions.
Disclaimer: Keep in mind that the interpretation of HRV parameters is complex. It is essential to consult a professional healthcare provider or trained coach to interpret the results and understand their significance in the context of an individual’s overall health and training status.
What is Heart Rate and Heart Rate Variability
Heart rate is the number of times a person’s heart beats per minute. When the heart beats, it pumps blood through the body. The number of times it beats each minute determines the blood flow rate. A normal heart rate for an adult at rest is between 60 and 100 beats per minute. However, there is a variation in the time between the beats, called Heart Rate Variability.
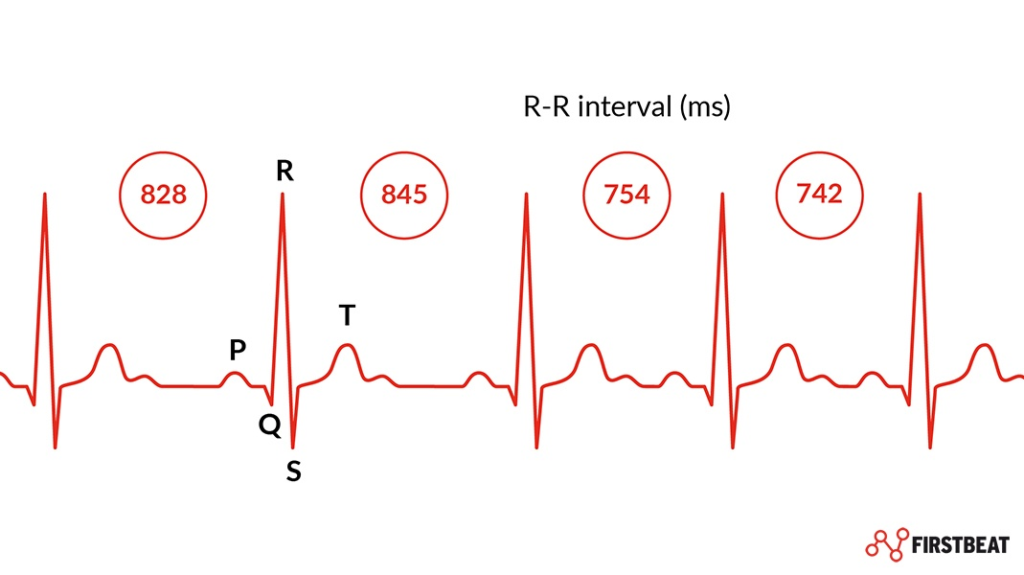
Measuring the length of time between beats in milliseconds results in a log that looks like this:
828
845
754
742
880
859
…
909
843
876
Note that the first value, 828 is the time between the first and second heartbeats in this series. 845 is the time between the second and third heartbeats in the series. And so on. These intervals are called RR values.
How To Measure Heart Rate Variability
Historically, these measurements required an electrocardiogram (ECG) operated by trained technicians in a medical environment. With recent technological advances, however, accurate measures can be made at home using many devices. These include:
- Polar, Garmin, Movesense, and others provide high-quality chest strap-mounted heart rate monitors.
- Photoplethysmogram (PPG) technology is typically used in wrist-worn devices that measure pulse through the skin. PPG is subject to artifacts related to arm motion and, thus, is not always as accurate as using a chest strap. Vendors who sell these devices include Whoop, Garmin, Polar, and HRV4Training (who use a smartphone camera and flash as a light source).
Obtaining reliable data over time requires that measurements be taken with the same device at roughly the same time every day while in the same position. The following are generally accepted specific guidelines for taking daily readings:
- Take the HRV measurements immediately upon waking.
- Measure for a short time – 1 to 3 minutes
- Assume the same position every day – usually seated.
The Science of Heart Rate Variability
The heart is part of the autonomic nervous system (ANS), which regulates bodily functions not under conscious control. Several interconnected areas of the central nervous system (CNS), including the hypothalamus, brainstem, and spinal cord, regulate the output of the ANS.
The ANS consists of two branches, the parasympathetic nervous system (PNS), which includes the vagus nerve, and the sympathetic nervous system (SNS). These two branches operate in opposition to each other and regulate many crucial bodily functions, including control of mood, immune response, digestion, blood pressure, and heart rate, by sending signals to internal organs to slow down or speed up their activity.
Together, these branches work to regulate heart rate (HR) by lowering it (parasympathetic activity) or increasing it (sympathetic activity). At any given moment, HR results from balancing these two branches. When HR is below an individual’s baseline, the parasympathetic branch dominates. On the other hand, when HR is above the baseline, it suggests that the sympathetic branch is more active, which is associated with an increased risk of morbidity and mortality in certain conditions.
Sympathetic Nervous System (SNS)
The SNS, responsible for the body’s “Fight or Flight” response, is activated in response to environmental stress, danger, or threats. It prepares the body for intense physical activity by increasing heart rate, blood pressure, and blood flow to the muscles. The SNS response is the same whether the danger is real or imagined.
The elevated heart rate caused by activation of the SNS reduces HRV. When the heart beats quickly, there is less time between beats for significant variability. Thus higher heart rate due to SNS activation results in lower HRV. This response disrupts digestion, suppresses immunity, increases anxiety, and can be a significant health hazard if chronic.
SNS activation is associated with inhalation because it increases breathing rate and depth. It does so to increase oxygen flow into the body to meet the needs of increased metabolism during times of stress.
Parasympathetic Nervous System (PNS)
The PNS monitors input from internal organs like the heart and lungs and is activated when the body is at rest and free from danger, known as “Rest and Digest.” Activation causes the heart rate to slow down. When the heart beats slowly, the time between beats is longer, providing more time for significant variability. As a result, HRV increases. The PNS also lowers blood pressure and helps the body relax.
Arterial Baroreceptors
Arterial baroreceptors are specialized stretch-sensitive nerve endings located in the walls of the chambers of the heart, aorta, vena cavae, and carotid sinuses. They play an essential role in the control of ANS output. The baroreceptors detect changes in blood pressure and send signals to the brain to adjust the activity of the SNS and PNS accordingly. For example, baroreceptors signal the SNS to increase heart rate and blood pressure if blood pressure drops. If the blood pressure rises, they signal the PNS to decrease heart rate and blood pressure.
The autonomic nervous system is an intricate network that relies on multiple central nervous system regions to maintain equilibrium between the sympathetic and parasympathetic branches. Heart rate variability is closely tied to this balance and indicates the system’s state at any moment.
Finding Balance
As discussed above, the PNS and SNS compete by simultaneously sending signals to the heart. The PNS tells the heart to beat slower, and the SNS tells the heart to beat faster, causing second-to-second fluctuations in HR, which is HRV. When the central nervous system is balanced, the HRV value will fall into an individual’s normal range. When the CNS is out of balance, the variation will move off-center toward the stronger signal.
HRV Normal Range
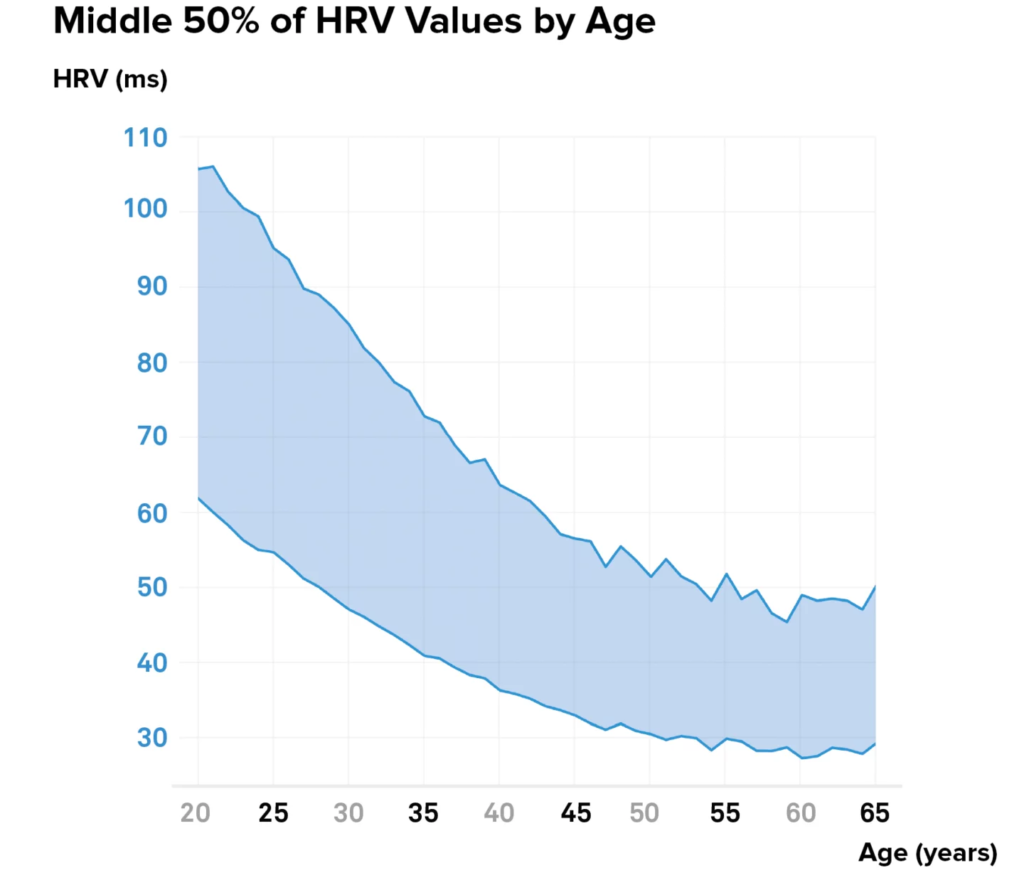
Heart rate variability is highly individual and varies by many factors, including age, gender, alcohol consumption, physical condition, and time of day, to name a few.
It is impossible to compare individual HRV values with population-based normal ranges. For example, here we can see that the HRV for 50% of 25 year old’s varies from 55 to 105. Attempting to compare an individual’s HRV value with ranges like this is of little value. The following are a few of the factors that affect HRV:
- Age – Young people have higher values than older people
- Gender – Males have higher values than females
- Fitness – Athletes have higher values than sedentary people
- Endurance – Endurance athletes have higher values than non-endurance athletes
- Genetics
HRV varies significantly from person to person and throughout the day, as previously discussed. It is best measured at the same time every day, usually upon waking, and then evaluated by comparing the current values against the individual’s short and long-term trends.
For athletes in training, expect an upward slope over the long term. Daily fluctuations will occur based on the difficulty of training, sleep quality, diet, and more.
Acute stressors affect physiology and can cause a low HRV. These stressors include an intense workout, alcohol consumption, travel, sickness, and anything that has a physiological effect lasting from a few hours to a few days.
Preprocessing of Heart Rate Variability Measurements
Accurate HRV measurements require RR data containing little or no disturbances or noise. Cleaning the data by removing these artifacts is a multi-step process:
- Noise Detection
- Noise is external interference associated with the electronic measuring device. When significant noise makes actual heartbeats unmeasurable in a chunk of data, that chunk is removed from the analysis.
- Beat Correction
- Abnormal beats are identified and removed. These can be missing beats, extra beats, or misaligned beats. External factors, such as noise in the signal, or internal factors, such as abnormalities in heart rhythm like ventricular ectopic beats, cause these problems.
- Trend Removal
- Trend removal eliminates very low-frequency components in the interbeat interval data, making the short-term analysis of HRV more responsive to the low and high-frequency variability controlled by the sympathetic and parasympathetic branches of the autonomic nervous system.
Normalized (NN) intervals, used to calculate HRV Parameters, represent the cleaned RR data set.
Heart Rate Variability Parameters
It would not be helpful if HRV were nothing more than a list of numbers representing beat-to-beat variations in time. Instead, several statistical calculations are employed to extract meaning from that list of numbers. The three most commonly used statistical categories are the frequency domain, the frequency domain, and non-linear evaluations.
Frequency Domain
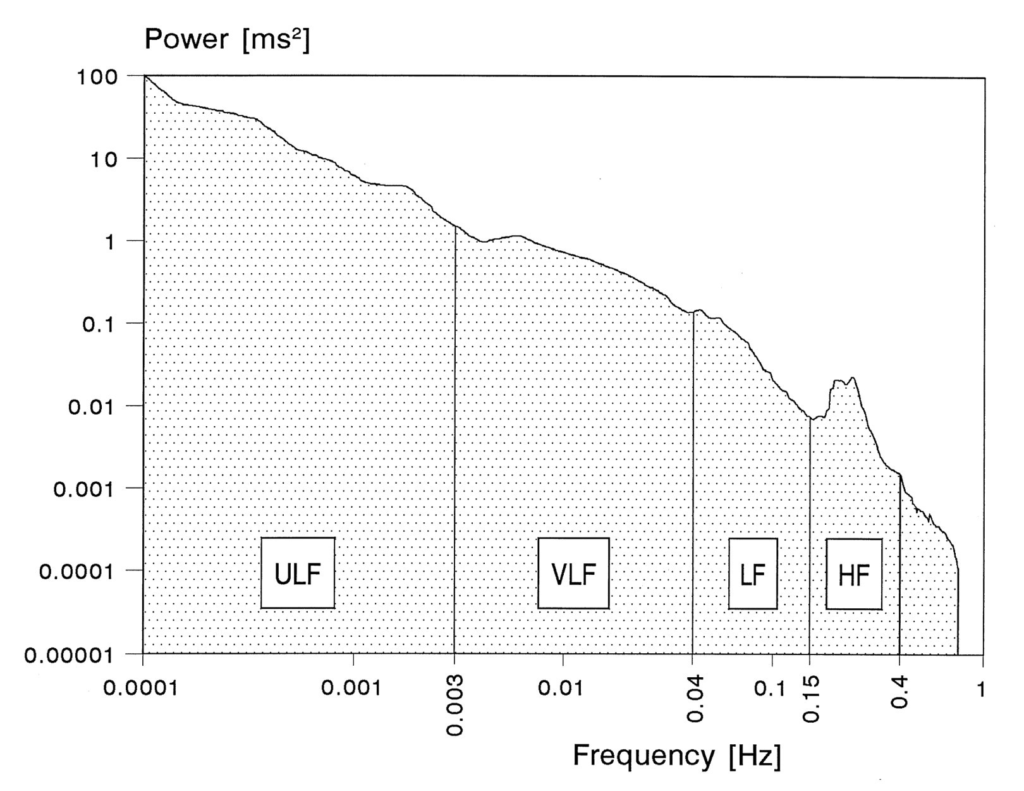
The intricate interplay between the autonomic nervous system, blood pressure regulation, breathing, and other physiological control mechanisms leads to short-term and long-term patterns in Heart Rate Variability (HRV) measurements. By analyzing HRV in the frequency domain, we can break down the complex waveform into its constituent rhythms. These patterns provide a better understanding of how frequency (variance and amplitude) is distributed within the waveform as a function of frequency (the period of a given rhythm).
Frequency domain measures are superior to time domain measures because they supply both frequency and amplitude information about the specific rhythms in the HRV waveform, thus providing a means to quantify these oscillations over any given period. This information can provide valuable insights into the autonomic nervous system’s activity and the cardiovascular system’s overall health.
The component bands of interest are the High-Frequency and Low-Frequency bands. Very-Low-Frequency bands do not apply to short-term analysis, and little is known about the Ultra-Low-Frequency band.
High-Frequency Band (HF)
What Is It?
The HF band is in the 0.15 to 0.4 Hz range and reflects parasympathetic activity. The HF or Respiratory band corresponds to HR variations related to the respiratory cycle, known as respiratory sinus arrhythmia (RSA). Heart rate increases during inhalation and decreases during exhalation.
The high-frequency band correlates with the RMSSD and PNN50 time-domain measures. The HF band may be higher at night than during the day, which is essential to keep in mind when comparing values.
Why Is It Important?
HF is one of the best cardiovascular health and fitness measures when evaluated over time. It is a good indicator of vagal tone, which relates to an athlete’s ability to recover from intense workouts. HF is also used to monitor the effectiveness of an athletic training plan and to predict athletic performance.
A Low HF is linked to stress, panic, anxiety, fatigue, and worry and can lead to cardiac and other health problems and increased morbidity.
Slow, deep breathing, exercise, sleep, meditation, and proper hydration will increase the HF band.
Low-Frequency Band (LF)
What Is It?
The vagally mediated LF Band measures frequency between 0.04 – 0.15Hz, reflecting resting baroreceptor activity. Baroreceptors are stretch-sensitive mechanoreceptors found in the walls of the chambers of the heart, aorta, vena cavae, and carotid sinuses. Baroreflex gain, calculated as the change in HR per unit of change in blood pressure, measures how well the body regulates heart rate with changes in blood pressure.
Why Is It Important?
Decreased baroreflex gain (the ability of the body to adjust to changes in blood pressure) is related to aging and impaired regulatory capacity, thus increasing the risk for hypertension.
In addition, a low LF band can signify increased sympathetic nervous system activity caused by stress, overtraining, or disease.
LF/HF Ratio
What Is It?
LF/HF Ratio shows the relationship between the HF and LF bands. The value is simply the power of the low-frequency band (LH) divided by that of the high-frequency band (HF).
Why Is It Important?
A high ratio indicates SNS dominance and is often associated with stress and increased risk of cardiovascular disease.
A low value indicates PNS dominance which is associated with recovery and relaxation. Endurance-trained athletes often have a lower ratio that will trend lower with physical training. Short-term increases indicate poor recovery and suggest that rest is needed.
Time Domain
Using statistical measures over time, the Time Domain measures represent the interbeat interval (IBI) variance. It does not provide a means to determine autonomic dynamics or rhythmic or oscillatory activity, as in the Frequency Domain.
SDNN
What Is It?
The SDNN (Standard Deviation of Normal-to-Normal Intervals) measures the variability in the time intervals between normal heartbeats by calculating the standard deviation of the NN intervals.
SDNN is a marker of the overall variability of the heart rate. It is considered an indicator of the balance between the sympathetic and parasympathetic branches of the autonomic nervous system (ANS).
Why Is It Important?
SDNN is a principal measure of HRV (Heart Rate Variability) because it reflects the combined activity of the autonomic nervous system’s sympathetic and parasympathetic branches (ANS). As a non-specific measure of HRV, it is a general indicator of the overall activity of the ANS and, as such, can be used to evaluate the effectiveness of athletic training to improve cardiovascular function.
A high SDNN value, relative to an individual’s baseline, indicates a high level of HRV and a good balance between the sympathetic and parasympathetic branches of the ANS, which is associated with better cardiovascular health and fitness.
Low values, relative to an individual’s baseline, indicate potential health problems and an increased risk of death.
RMSSD
What Is It?
RMSSD (Root Mean Square of Successive Differences) is the square root of the mean sum of the squares of differences between successive NN intervals. It is an indicator of vagal activity, which is the activity of the parasympathetic branch of the ANS.
RMSSD is the primary time domain measure to determine the vagally mediated change in HRV. The PNS has more influence on the value than the SDNN, making it a more specific indicator of parasympathetic activation.
Why Is It Important?
RMSSD is an essential measure of HRV because it is a specific measure that reflects the activity of the parasympathetic nervous system. According to a study conducted by (Malik et al., 1996), 1, RMSSD is considered a more specific measure of parasympathetic activity than other HRV measures, such as the SDNN.
Additionally, RMSSD is known to be a good predictor of cardiovascular health, fitness, endurance performance, and recovery in athletes.2
A high value relative to an individual’s baseline is associated with good cardiovascular health and fitness. Studies have also shown that RMSSD can predict endurance performance 2, recovery, and autonomic dysfunction in patients with heart disease.
PNN50
What Is It?
PNN50 (Percentage of Normal-to-Normal Intervals that are more than 50ms different) measures the time intervals between successive normal heartbeats that differ by more than 50ms expressed as a percentage of the total number of NN intervals.
Why Is It Important?
PNN50 is sensitive to the high-frequency components of HRV, which reflect the activity of the parasympathetic nervous system.
A high PNN50 value indicates a high level of vagal activity and a good balance between the sympathetic and parasympathetic branches of the ANS, which is associated with better cardiovascular health and fitness.
RMSSD is a better indicator for fitness applications than PNN50 because it is less affected by respiration.
Non-Linear Domain
Poincaré SD1 and SD2
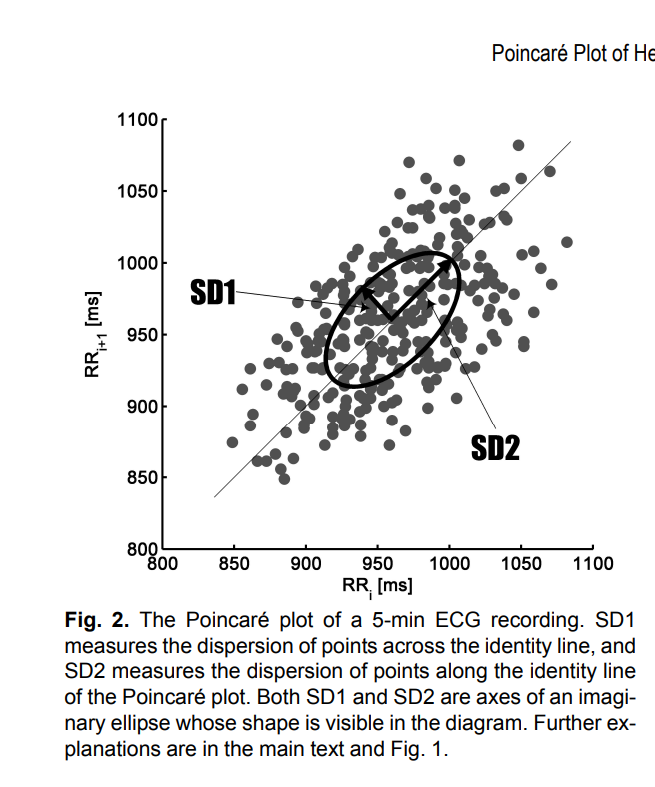
HRV Poincaré is a way to analyze heart rate variability visually and provides information about the functioning of the autonomic nervous system. HRV Poincaré is a graphical representation of HRV that displays each R-R interval plotted against the previous R-R interval. This plot can provide insight into the complex behavior of the autonomic nervous system and has applications in various fields, including sports science, cardiology, and psychology.
Plotting each RR interval against the one that precedes it results in a graph, as seen in the image below. The “line of identity” refers to the straight line on the plot that passes through the origin and has a slope of one. Values along this line represent cases where each R-R interval equals the previous one. It follows that points close to the line represent a stable heart rate with little variability, while points farther from the line represent greater variability. The standard deviation of points along the line and perpendicular to the line provides information about short-term and long-term variability.
SD1
SD1 measures the standard deviation of the distribution along the line of identity on the HRV Poincaré plot and is an indicator of short-term HRV. The value is thought to reflect the activity of the PNS and is similar to the RMSSD. 2
An elevated SD1 indicates a high level of vagal activity and a good balance between the SNS and PNS, which is associated with excellent fitness and cardiovascular health.
SD2
SD2, on the other hand, is a measure of the standard deviation of the distribution perpendicular to the line of identity on the HRV Poincaré plot and can indicate long-term and short-term HRV. 2 Poincaré SD2 is linked to SDNN and correlates with LF/HF ratio.
Poincaré SD2 evaluates cardiovascular health and fitness over time and the effectiveness of interventions to improve cardiovascular function.
Poincaré SD2 also predicts mortality and morbidity in patient populations with heart disease, making it a valuable tool in clinical settings.
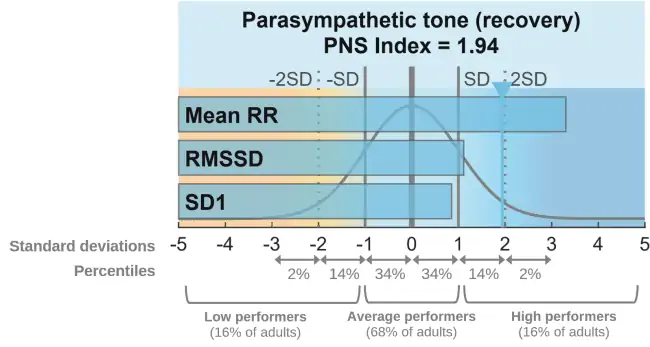
Kubios PNS and SNS Indices
The company Kubios developed a pair of indices that measure parasympathetic and sympathetic activity, each based on three parameters.
Parasympathetic nervous system (PNS) index
- Mean RR Interval where a longer mean interval indicates parasympathetic cardiac activation
- RMSSD, which is the time-domain HRV parameter that measures quick beat-to-beat changes in RR interval and also measures parasympathetic cardiac activation
- Poincaré plot index SD1 in normalized units
Sympathetic nervous system (SNS) index
- Mean HR – elevated heart rate relates to sympathetic activation
- Baevsky’s stress index (SI) – a geometric measure that also indicates sympathetic activation
- Poincaré plot index SD2 in normalized units
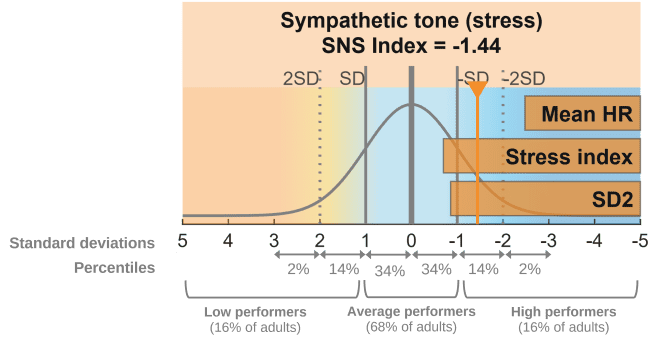
These index values provide an additional view of autonomic system balance with the added benefit of comparing individual values to population statistics.
Heart Rate Variability Trends
Plotting HRV values daily with a moving average based on a five to seven-day timeframe will establish an individual’s baseline. For example, athletes in training expect to see an upward slope over many months because as cardiovascular fitness improves, HRV does as well.
Comparing daily Heart Rate Variability (HRV) values to long-term trends and medium-term moving averages can provide valuable insights into an individual’s health and training status because HRV is affected by various stressors, such as overtraining, stress, menstrual cycles, alcohol consumption, sickness, and travel, which can lower HRV values. Monitoring both short-term and long-term trends in HRV makes it possible to understand better an individual’s current state of health and how various stressors may impact it.
Training Guided By HRV Vs. Block Periodization
It is well established that HRV quantifies individual responses to training stress. A June 20205 study titled “Training Prescription Guided by Heart Rate Variability Vs. Block Periodization in Well-Trained Cyclists” shows that most gains come when training intensity matches an individual’s readiness to handle it. When that is so, positive adaptations result. Comparing the athlete’s daily HRV with their historical trend data determines their readiness.
Periodization, characterized by built-in rest and slow progression, can be improved using HRV for guidance. This study compared HRV-guided training against Block Periodization in cyclists. The study concluded that HRV-guided training improves measures including VO2max, Peak Power Output (PPO), and ventilatory thresholds over block periodization. They concluded that
“Despite the beneficial effects reported by block periodization models, concentrated workloads without valid and reliable measures of the response to training could lead to an overreached state that limits training adaptation. In this study, HRV was used to determine whether athletes were able to perform high-intensity training”
“The evidence from this study gives further supports to the notion that HRV is a valid and reliable tool to detect the daily recovery/fatigue and subsequently prescribed training in well trained cyclists. Thus, the implementation of daily HRV measurements and practical methodologies to change the training prescription on a daily basis could lead to better timing in prescription, thereby giving greater insight into the programming puzzle and optimizing training regimes to enhance both fitness and performance”
How to improve HRV
HRV (Heart Rate Variability) indicates cardiovascular health, so adopting habits that enhance overall well-being will result in better HRV. The following are some guidelines 6:
- Intelligent Training – monitor the frequency and intensity of the training by comparing short-term values to longer-term trends.
- Rest – schedule easy days after hard days and build in rest
- Hydration – essential for proper body functioning, including the cardiovascular and central nervous systems.
- Diet – healthy diet on a regular schedule, avoiding eating close to bedtime
- Sleep – Quality Sleep
- Avoid Alcohol – one night of drinking decreases HRV for up to five days 5
- Natural Light Exposure at sunrise has been proven to reset the circadian rhythm by triggering processes that regulate sleep and wake time, energy levels, and hormone production
- Cold thermogenesis – exposure to cold temperatures for brief periods stimulates the vagus nerve that activates the PNS
- Breathwork combats stress which inhibits HRV. 7
- Mindfulness and Meditation
- Gratitude Journaling
Conclusions
In conclusion, Heart Rate Variability (HRV) is a valuable tool for assessing the function of the autonomic nervous system and overall health. HRV provides insights into the balance between the autonomic nervous system’s sympathetic and parasympathetic branches by measuring the time variation between successive heartbeats. These insights are most effective when viewed over time.
A stable or upward-trending HRV suggests good overall health and a healthy autonomic balance, while a downward-trending HRV indicates an autonomic imbalance associated with increased health risks. HRV has significant applications in athletic training, as it can monitor the effectiveness of training regimens, predict cardiovascular distress, and help identify potential health problems early. However, HRV is highly individual and influenced by age, gender, fitness level, and genetics.
HRV readings are most accurate when taken first thing in the morning, usually in a seated position. Consistency is key. Various statistical calculations, including time domain and frequency domain measures, extract meaningful information from the HRV data. Frequency domain measures provide insights into the distribution of frequency and amplitude within the HRV waveform, while time domain measures assess overall heart rate variability.
HRV is a robust, objective biomarker that must be evaluated with subjective data to be helpful in health-related decision-making. HRV measured alone can give a snapshot of the general state of the nervous system but requires additional context to reflect systematic health status.
References
- Kubios Heart Rate Variability
- Everything You Need to Know About Heart Rate Variability (HRV)
- https://www.ncbi.nlm.nih.gov/pmc/articles/PMC5624990/
- 8. Altini, Marco. “Heart Rate Variability (HRV) Trends: Going beyond Daily Scores.” Medium (blog), January 22, 2023. https://medium.com/@altini_marco/heart-rate-variability-hrv-trends-going-beyond-daily-scores-d32609c1eddd.
- Javaloyes, Alejandro, Jose M. Sarabia, Robert P. Lamberts, Daniel Plews, and Manuel Moya-Ramon. “Training Prescription Guided by Heart Rate Variability Vs. Block Periodization in Well-Trained Cyclists.” Journal of Strength and Conditioning Research 34, no. 6 (June 2020): 1511–18. https://doi.org/10.1519/JSC.0000000000003337.
- 10 Ways to Improve Your Heart Rate Variability
- Reed, M.J., C.E. Robertson, and P.S. Addison. “Heart Rate Variability Measurements and the Prediction of Ventricular Arrhythmias.” QJM: An International Journal of Medicine 98, no. 2 (February 1, 2005): 87–95. https://doi.org/10.1093/qjmed/hci018.
- www.ondrejfirla.eu. “Spectral Analysis of Heart Rate Variability | Academy | Heart Rate Variability and Its Monitoring through MySASY Diagnostics.” Accessed January 26, 2023. https://www.mysasy.com/spectral-analysis-of-heart-rate-variability.
- Shaffer, Fred, and J. P. Ginsberg. “An Overview of Heart Rate Variability Metrics and Norms.” Frontiers in Public Health 5 (September 28, 2017): 258. https://doi.org/10.3389/fpubh.2017.00258.
- MedicineNet. “How Can I Improve My HRV? 9 Ways.” Accessed January 28, 2023. https://www.medicinenet.com/how_can_i_improve_my_hrv/article.htm.
- m Power Spectrum Analysis of Heart Rate Fluctuation: A Quantitative Probe of Beat-ToBeat Cardiovascular Control, S. Akselrod, et.al. Science Vol. 213, 1981
- Electrophysiology, Task Force of the European Society of Cardiology the North American Society of Pacing. “Heart Rate Variability.” Circulation 93, no. 5 (March 1996): 1043–65. https://doi.org/10.1161/01.CIR.93.5.1043.
- Firstbeat. “What Is Heart Rate Variability (HRV) & Why Does It Matter? | Firstbeat Blog.” Accessed January 31, 2023. https://www.firstbeat.com/en/blog/what-is-heart-rate-variability-hrv/.